Use Case
Automated PDF report generation
Build report templates with sections, tables, charts, and summaries. Feed your metrics via API and get formatted, branded reports ready to share with stakeholders.
Manual reporting pain
- Hours spent formatting Word/Sheets exports every week
- Inconsistent branding across departments
- No way to automate periodic report delivery
Automated with templates
- Define report layout once — tables, sections, header/footer
- Pass metrics from your database or analytics pipeline
- Schedule via cron, webhook, or trigger from any workflow
Render a report with one API call
const report = await fetch('https://api.pdfs.build/v2/organizations/org_abc/templates/quarterly-report/render', {
  method: 'POST',
  headers: {
    'Authorization': `Bearer ${API_KEY}`,
    'Content-Type': 'application/json'
  },
  body: JSON.stringify({
    data: {
      quarter: 'Q1 2025',
      revenue: 1_250_000,
      growth: 0.12,
      departments: [
        {  name: 'Engineering', headcount: 42, spend: 580000 },
        {  name: 'Sales', headcount: 18, spend: 320000 }
      ]
    }
  })
})
Wiring it into a schedule
Reports are rarely rendered by a person clicking a button — they run on the last day of the month,
or after the ETL job finishes, or when a customer hits "export". Because a render is a single
request that returns application/pdf
synchronously, it drops into whatever already runs on a schedule: a cron job, a queue worker, a
Lambda, a dbt post-hook, an n8n step.
One template, every period
Q1 and Q4 are the same request with a different payload. Changing the layout changes every future report at once, and does not touch the ones already issued.
One per customer
Loop the same call over an account list to produce a per-customer report. The design holds whether a customer has two rows of data or four hundred.
Visible when it breaks
Render logs record every run with its status and source, so a batch that half-failed at 3am is something you can find rather than something a stakeholder reports.
Reports grow in ways invoices do not
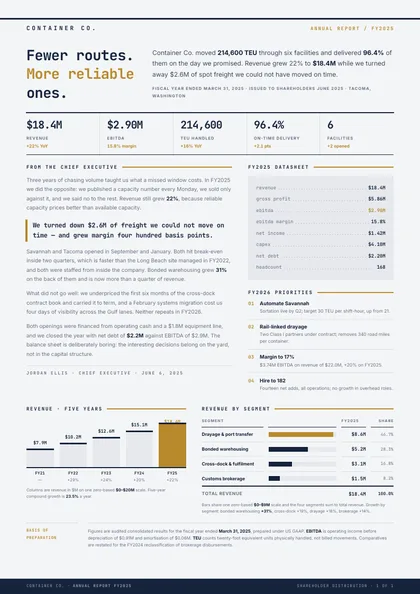
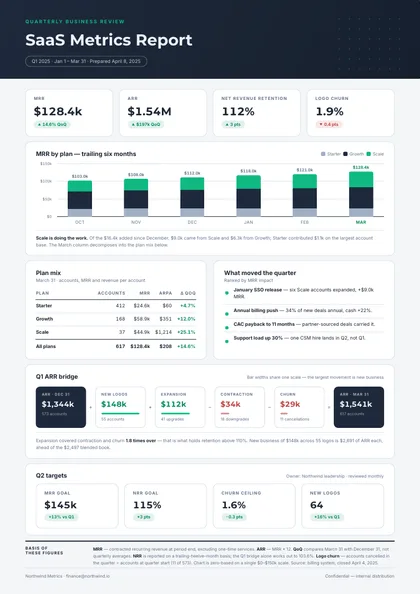
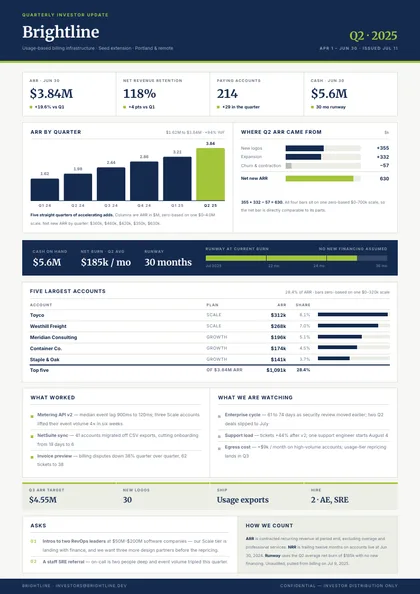
A report is a document whose length you do not control. One month has three campaigns and the next has thirty; a good quarter adds commentary that a flat one does not. The report designs are built so the shape survives that:
- Metric cards keep their grid. Four KPIs or nine, the cards stay on the same rhythm instead of stretching to fill the row.
- Sections repeat per record. A channel, a department, a product line — one block of your data becomes one block on the page, however many there are.
- Running heads and folios hold. On a forty-page pack the reader always knows which section and which page they are on.
- Charts and their captions stay together. A figure never ends up orphaned on the page before the text that explains it.
Each design's page spells out what repeats, what grows and what is pinned, so you can pick one knowing how it will behave on your worst-case month.
Report templates to get started
See every design →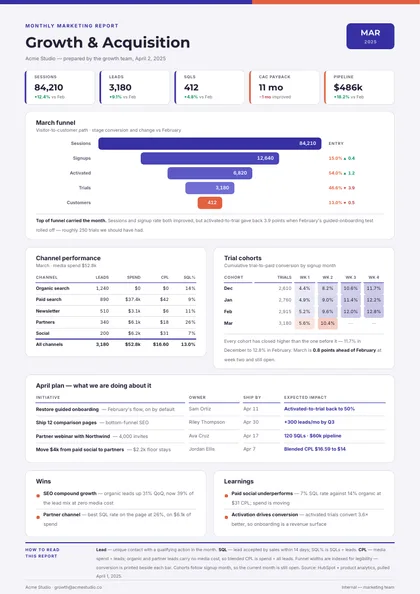
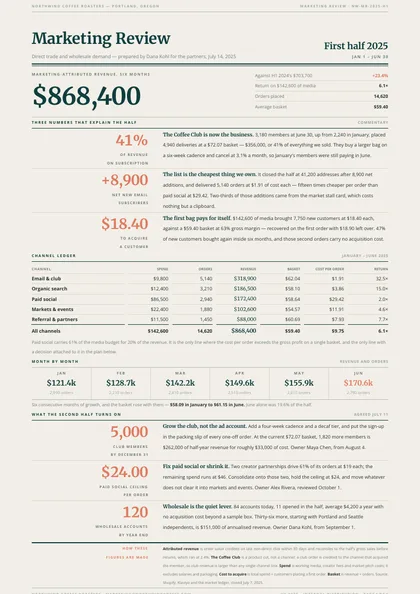
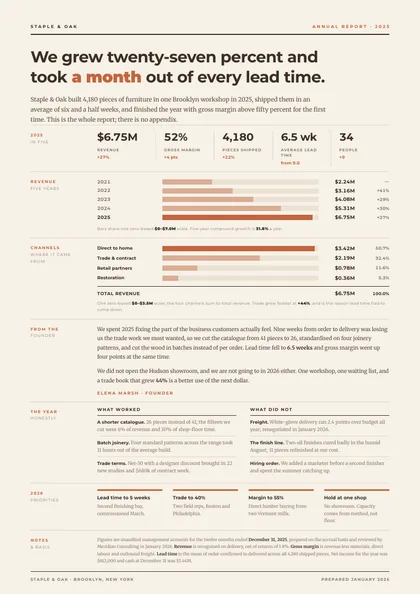
The mechanics behind this are the same for every document type: define the template once, make the parts that change into dynamic fields, and render each report through the API.
Building a SaaS whose customers need their own report designs? The embedded document editor puts this designer inside your product, white-label, with per-tenant billing.
Automate your reports today
Free tier includes 2 templates and 50 watermarked PDF renders per month. No credit card required.
Start building free